


(This story was originally published in print on Mar. 28, 2019).
Associate professor of mathematics Jason Wilson never cared deeply for baseball. When I discussed the career achievements of some famous Major League Baseball pitchers with Wilson recently, he knew little about them without consulting his notes.
Since 2010, though, Wilson has contributed more to the statistical analysis of baseball than most could ever hope to in their lifetimes. He is the co-founder and overseer of the Quality of Pitch metric, which uses advanced MLB pitch-tracking data in order to quantify how good each pitch is.
Wilson may not get as much enjoyment as the average baseball fan from watching Los Angeles Dodgers pitcher Clayton Kershaw throw one of his trademark curveballs or sliders. With a simple search and a few clicks on QOP’s online player database, though, Wilson can tell you that in each season since 2012, the overall quality of Kershaw’s pitches has clocked between 4.76 and 4.99 on Wilson’s Quality of Pitch Average scale, which rates a QOPA of 4.50 as an average pitch.
Dig a little deeper into Kershaw’s numbers, and the QOP database can explain why Kershaw’s pitches are consistently above average. Kershaw’s lateness of break, which tracks how long his pitches remain in the air before swerving away from opponents’ bats, has remained in an above-average percentile since 2012. The vertical break of his pitches has dipped below the 70th percentile just once in that timeframe, a piece of empirical data that should surprise nobody who is used to watching Kershaw’s big, looping curveball make batters look foolish.
The database can even show how Kershaw has adjusted as injuries have pushed him past his physical prime. The average velocity of Kershaw’s pitches has registered as below average in every season since 2016, when he first dealt with a major back injury. Over the past three years, though, Kershaw’s overall QOPA has actually improved as his vertical break—the same category we just looked at—has shot up into 90th percentile range.
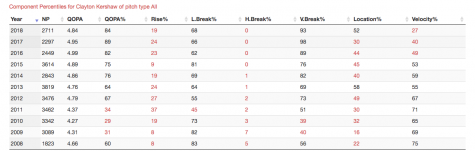
Clayton Kershaw’s QOP metrics show his overall quality of pitch average, its percentile compared to the rest of major league pitchers, and the percentiles of some key components to his pitches
CLASS PROJECT GETS COMPLEX
It all started with an assignment in Wilson’s introduction to probability and statistics class, and one student’s response to the assignment.
Jarvis Greiner was not a mathematics major, but he had two attributes that made him perfect to help develop the new stat. Jarvis was not only a pitcher on Biola’s baseball team who had grown up around the sport, but he was also a film major, meaning he had access to the Production Center.
“An unusual combo,” Wilson said. “His idea was, ‘How can I break down a curveball and analyze its fundamental components?”
That was how Wilson, Jarvis Greiner and some of Greiner’s teammates found themselves in the Production Center one day, with the pitchers throwing curveballs alongside walls that had horizontal lines of tape on it. They set up high-speed video cameras to record three different angles of the pitches and used the footage and wall tape to track the curves of the pitches on a two-dimensional, vertical plane.
As the teacher and student processed and analyzed the data, Wilson quickly came to a realization. The data was far more complex and independent than the material they had covered in Wilson’s class. They were on to something.
“It [was] just a very elegant discovery, really,” Wilson said. “It was compelling enough that I wrote it up for publication.”
The response of peer reviewers from Chance, an academic journal from the American Statistical Association and Taylor & Francis Group, to an article submitted by Wilson and Jarvis Greiner confirmed the professor’s beliefs.
“It got two different reviewers,” Wilson said. “Normally they send their papers to one reviewer… They had a second [for this paper]. This high-powered reviewer to come at me with a whole second set of questions to go over and scrutinize it, and it made it through.”
Chance eventually published the article in a special sports-centric issue. By then, Wilson and Jarvis had brought on Jarvis’ father Wayne as a partner on the project. Through Wayne’s sports distribution business, he not only provided funding to patent the discovery, but also the connections to introduce the model to industry insiders. This allowed Wilson and Jarvis include more types of pitches and use publicly available raw data from MLB’s advanced pitch tracking systems, expanding their formula from two dimensions to three.
The original test of the system that would evolve into the QOP metric involved walls, tape and high-speed video cameras to track curveballs.
BIG REVEAL, SHOCKING RECEPTION
The next step was to present their findings to analysts from MLB teams at the annual Society of American Baseball Research analytics conference in Phoenix. Wilson and Wayne Greiner secured a seminar slot for their presentation, anticipating the same wave of response that the model had received in the academic world.
Their audience was not from that world.
“[There were] about 200 people in the room,” Wilson said. “And you know I said some pretty controversial stuff, we were kinda putting this thing out there. Hardly any questions. Had a few people come up afterwards and have very engaging conversations, [but] not a single team analyst.”
Wilson was dismayed until he later bumped into one of the team analysts who watched his seminar. The analyst revealed that not only had the entire room been riveted to the QOP presentation, but it touched on an area that all 30 teams were trying to explore.
But no self-respecting MLB franchise would be interested in using the statistic, Wilson recalled the analyst telling him, because it was publicly available and therefore offered no competitive advantage. In other words, QOP could only be useful to a team’s analytics department if it had sole access to the formula, in the same way a restaurant would hold tightly to a secret recipe.
“They’re competing against each other. 30 black boxes,” Wilson said. “It threw us off immediately. I was expecting things to be different, I think Wayne was as well.”
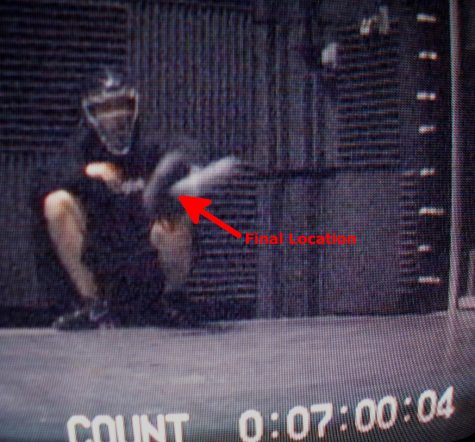
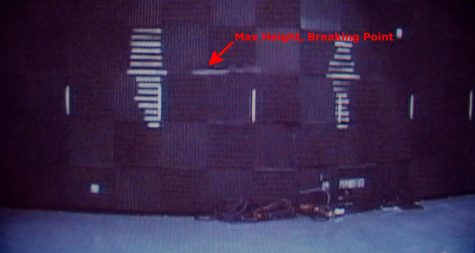
High-speed video footage shows the location of a curveball when it reached a catcher during Wilson and Greiner’s initial QOP test.
QOP CONTINUES
Of course, the QOP model still holds plenty of value. Last October, Wilson was quoted in an Orange County Register story explaining that a downturn in league-wide QOPA across the board between the 2016 and 2017 MLB seasons may provide evidence toward one of the biggest current controversies in the league—the composition of the baseballs themselves.
Additionally, the metric has been able to predict at least one major turnaround. When relief pitcher Blake Treinen was traded from the Washington Nationals to the Oakland Athletics in 2017, he was struggling through the worst season of a mediocre big-league career. Treinen’s QOPA, however, had hovered between 5.60 and 5.90 throughout his time in the majors—elite numbers that dwarf those of several All-Stars like Kershaw. After his change of scenery, Treinen lived up to that hidden value. In 2018, his first full season with Oakland, Treinen recorded 38 saves and an 0.78 ERA, made his first All-Star team, received MVP votes and helped the A’s to a surprising postseason berth. In some recent collaborative notes that Wilson showed me, Wayne Greiner called Treinen the QOP “poster child.”
Still, the QOP database remains a side project for all three of its leaders. Wilson still serves as the chair of Biola’s department of math and computer science and teaches several undergraduate classes in those majors. Jarvis Greiner realized his goal of entering the film industry, telling the Chimes before he graduated in 2012 that his role in the QOP model’s development helped put him at ease with leaving his baseball days behind. He is now a Christian movie director in Canada, according to Wilson. Wayne, meanwhile, still runs his business. The three still maintain the online database and talk periodically about ways to improve their model, such as coming up with companion statistics to apply it better to game situations.
Baseball may still not be Wilson’s first love, but he holds a deep appreciation for how God has worked through this unexpected trio to bring a lasting impact to the sport. During one trip to a SABR conference, Wilson felt led to take a different route. The new route led him past Chase Field in Downtown Phoenix, where a big advertisement on its side read, “Baseball, America’s favorite pastime.”
“When I saw that, the Lord distinctly impressed upon me that what I’m doing touches something about our culture,” Wilson said. “If we are able to advance this thing to a level where I would actually have a platform and some level of influence, this actually touches at a deep level with millions of people. To be able to represent Christ in that context, I had a sense he wanted to use that.”